

Anthropic vs. OpenAI: The Enterprise AI Race Has a New Momentum Leader

Key Takeaways
-
Anthropic leads all covered vendors in both absolute Net Score and year-over-year Net Score gain in the Summer 2026 Macro Views Survey, overall and among Global 2000 accounts.
-
OpenAI retains a top-tier absolute Net Score, but posts one of the largest year-over-year declines for a second consecutive survey.
-
Enterprise usage remains split between direct model access (31%) and embedded vendor tools (30%), but in-house AI builds now lead vendor solutions on sustained ROI at scale (16% vs. 13%).
-
Forward-looking spending intent at the model layer is a leading indicator on where enterprise AI budget dollars flow next, captured weeks before results appear in the earnings cycle.
Generative AI adoption is now near-universal across the enterprise. What is no longer uniform is how, and with whom, technology leaders spend their AI budgets. The Summer 2026 Macro Views Survey captures a bifurcation at the model layer that headline adoption numbers cannot show: two vendors hold elite spending intent scores, and only one of them is still climbing.
What Is the Macro Views Survey?
The Macro Views Survey is a recurring survey from ETR that captures forward-looking enterprise IT budget expectations, pricing trends, AI deployment strategies, and vendor-level spending intentions directly from the people who set and manage those budgets. The Summer 2026 iteration was fielded from June 2 to July 5, 2026, and drew 1,636 technology leaders, including 275 from Fortune 500 and 393 from Global 2000 organizations.
How Does ETR Measure Vendor Momentum?
ETR measures vendor momentum with Net Score, the percentage of a vendor's customers adding or increasing spend minus the percentage decreasing or replacing it. A high Net Score means expansion pressure dominates in a vendor's account base; a falling Net Score means that expansion pressure is thinning, even if the absolute level remains healthy. Because the measure is built on stated spending intentions rather than reported results, it moves ahead of the revenue prints that eventually confirm or contradict it. The vendor analysis below covers selected vendors with at least 50 citations in the survey.
Which AI Vendor Leads Net Score in Summer 2026?
Anthropic leads all covered vendors in the Summer 2026 survey on both dimensions that matter: the highest absolute Net Score and the largest year-over-year Net Score gain.
Vendors with elevated Net Scores typically face gravity; the larger the score, the harder it is to keep improving on it. Anthropic is doing both at once, and the strength shows up across every cut of the data:
-
Absolute Net Score leadership. Anthropic holds the highest absolute Net Score among covered vendors across all sectors, ahead of Databricks, OpenAI, AWS, Snowflake, and ServiceNow.
-
Year-over-year trajectory. Anthropic also leads the covered group in year-over-year Net Score gain, alongside gainers such as Arista Networks, JFrog, Netskope, and Kyndryl, and it ranked among the top gainers in the Spring 2026 survey as well.
-
Global 2000 strength. This is not a small-account phenomenon. Among Global 2000 respondents, Anthropic again ranks first in both absolute Net Score and year-over-year change; the accounts with the largest technology budgets show the same read.
-
Budget-direction resilience. Splitting respondents by overall budget direction, Anthropic holds a Net Score of 80% among customers cutting their overall IT spend and 86% among customers increasing it, the highest of any vendor in the survey and a narrow spread. Demand holds regardless of which way the broader budget is moving.
Is OpenAI Losing Enterprise Momentum?
OpenAI retains a top-tier absolute Net Score and massive enterprise reach, but its spending intent is decelerating, with one of the largest year-over-year Net Score declines for a second consecutive survey.
Both halves of that sentence matter:
-
Top-tier position intact. OpenAI remains near the very top of the absolute Net Score rankings alongside Anthropic, Databricks, AWS, and Snowflake, and it ranks second only to Anthropic among Global 2000 accounts. An account base this large carrying a Net Score this high is still a strong demand signal by any measure.
-
Direction of travel. In the Summer 2026 survey, OpenAI recorded one of the largest year-over-year Net Score declines in the covered vendor group. The Spring 2026 survey showed the same pattern, placing OpenAI among the largest decliners then as well. Two consecutive surveys of year-over-year erosion, set against Anthropic's consecutive top-of-group gains over the same periods, is a sustained directional split rather than a single-period blip.
What the data does not say is equally important. Net Score measures spending intent within each vendor's own customer base; it does not show accounts moving from one vendor to another, and both vendors continue to post spending intent levels most of the software universe would envy. The finding is narrower and more precise: expansion pressure is building in one account base and thinning in the other, at the same time, at the top of the same market.
Build vs. Buy: How Are Enterprises Consuming AI?
Enterprise usage is nearly evenly split, with 31% leaning entirely or mostly on direct GenAI and LLM access and 30% on AI embedded in vendor offerings, while in-house builds now lead on sustained ROI at scale.
Another 23% report equal usage of both approaches, and the share not using GenAI in any capacity fell to just 5%, continuing the decline from 12% in October 2024. The consumption model remains contested ground, which is precisely why vendor-level spending intent is worth watching.
The ROI data is where the usage split meets reality. Sustained ROI at scale is now more common for in-house AI builds (16%) than for external vendor solutions (13%), and the share citing no traction for in-house building has declined for three consecutive surveys. Pilots are producing returns on both paths, at 35% for in-house builds and 40% for vendor solutions.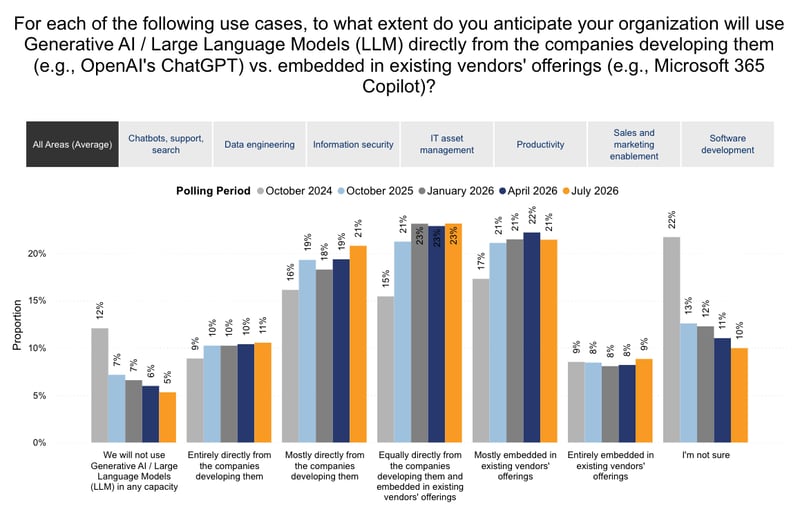
Read together, the consumption split and the ROI gap are consistent with a market where model-layer relationships are becoming direct, strategic decisions rather than features inherited through application vendors. That is the environment in which model-provider Net Scores diverge, because technology leaders are now choosing, and funding, their model partners deliberately.
Where AI Budget Dollars Flow Next
Net Score is a forward indicator: it captures what 1,636 technology leaders intend to do with their budgets, collected weeks before those intentions surface in reported results. At the model layer, that indicator now points in two directions at once. Anthropic holds the survey's highest spending intent and its strongest year-over-year improvement, overall and among Global 2000 accounts, with demand intact even inside shrinking IT budgets. OpenAI retains an elite absolute position while recording a second consecutive survey of outsized year-over-year decline.
The same survey shows why the stakes are rising. AI spending is running over plan at 47% of organizations, and the overruns are funded by cutting external contractors (61%), legacy infrastructure (49%), and non-AI software licenses (36%). Budgets under that kind of pressure raise the bar for demonstrated returns, and the ROI data already shows sustained returns at scale tilting toward in-house builds. In that environment, the divergence in model-layer spending intent is consistent with budget dollars concentrating where enterprises see durable expansion, and it lands well before the revenue prints. For investors tracking the AI trade, direction is the edge, and the direction is measurable.
Get the full picture. The complete Summer 2026 Macro Views Findings Report covers vendor-level Net Score performance across spending profiles, sector-level gains and declines, IT spending by category and vertical, and AI budget dynamics. Complete the form below to download the summary and gain access to the complete report.